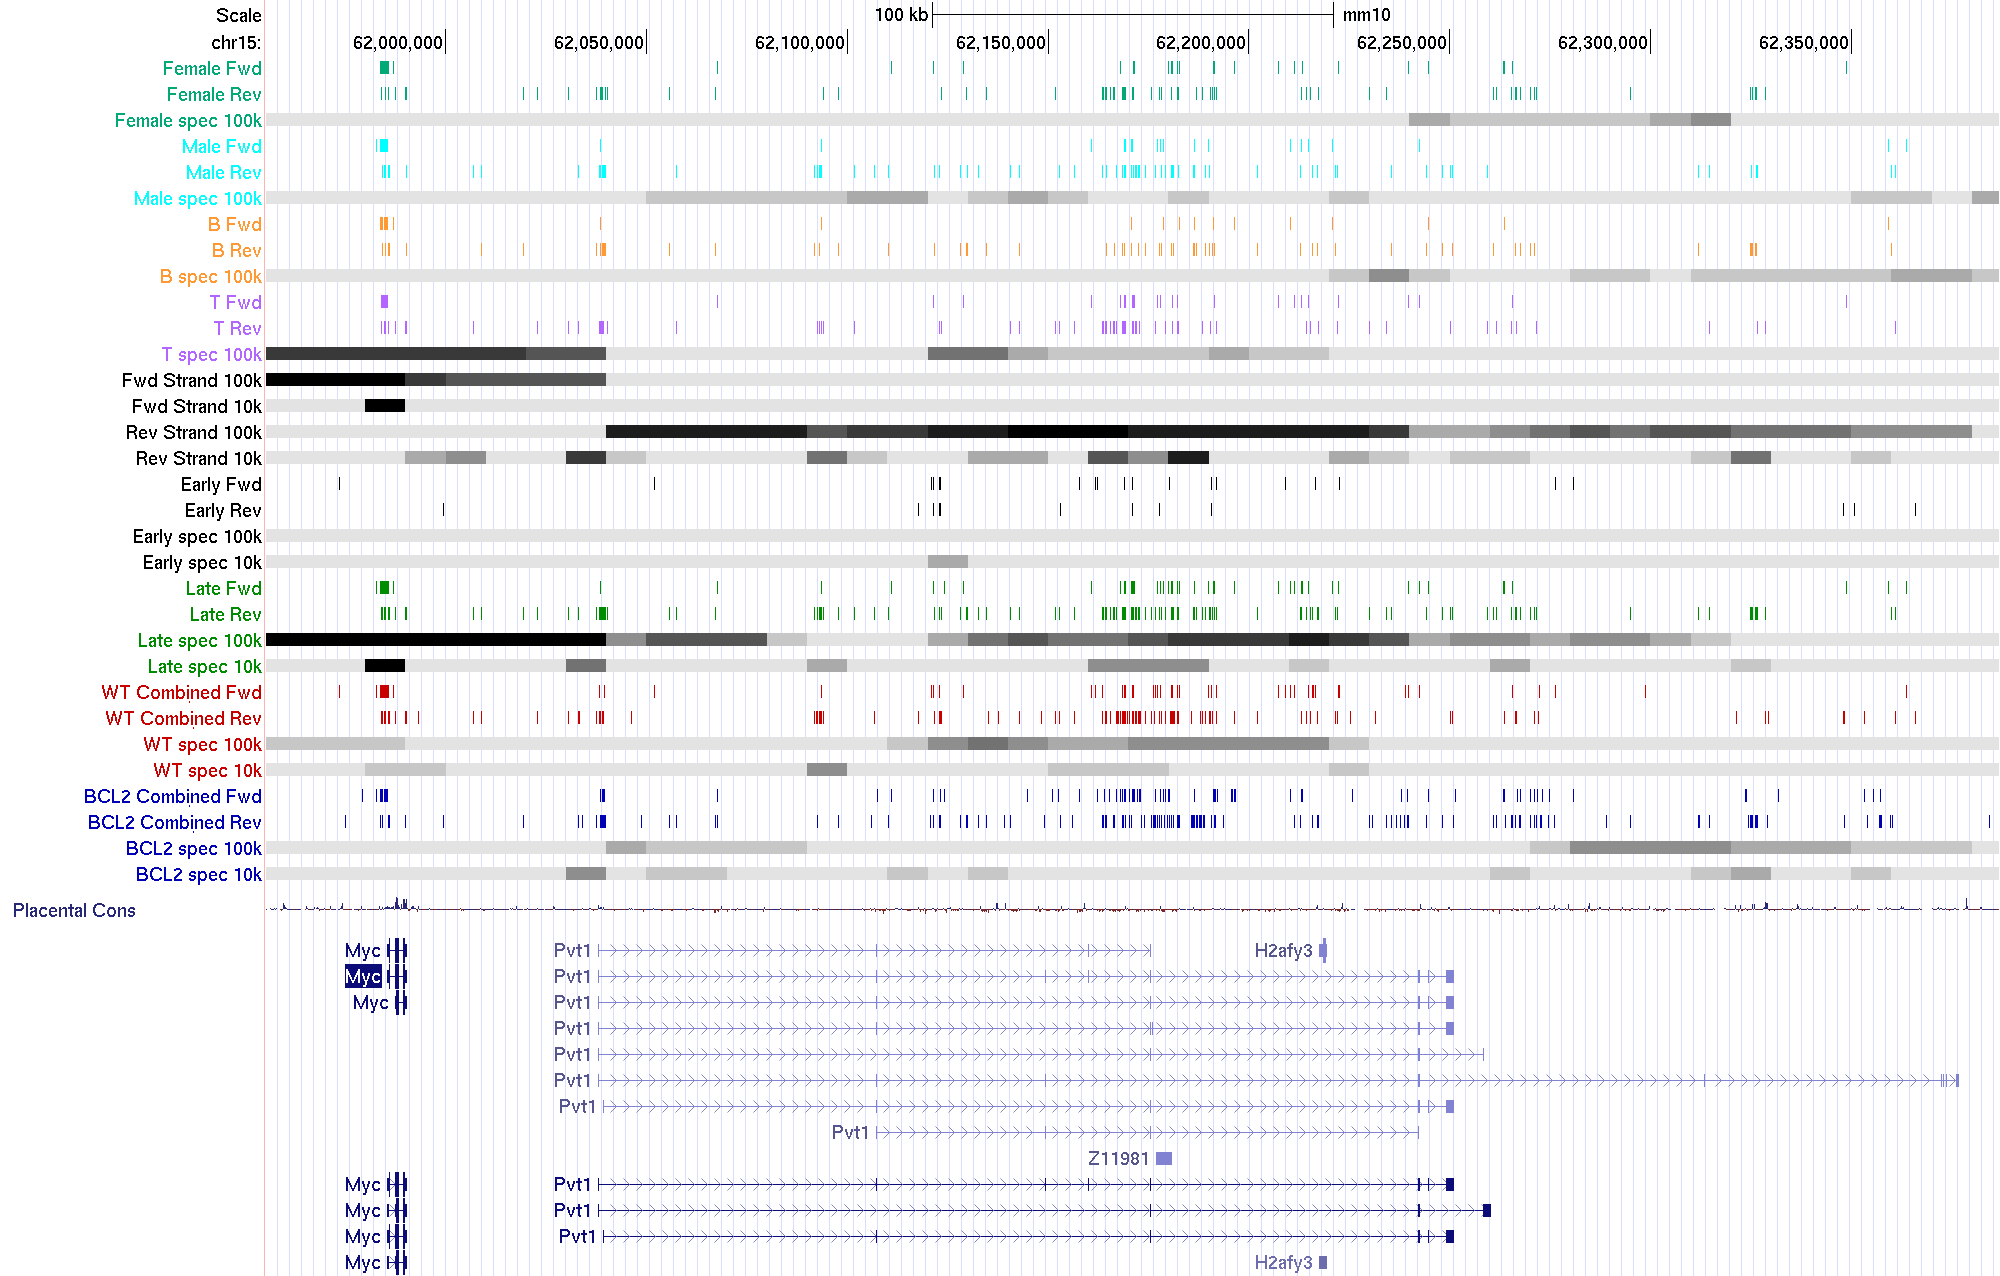
An example locus encoding Myc and Pvt1 is shown below.
Inserts are represented on the genome as tracks of vertical lines on the forward strand and reverse strand for each group (male/female, B cell/T cell lymphoma, early/late stage lymphoma, wild type/bcl2).
Solid tracks represent a sliding window of 100 kb or 10 kb used to identify regions of the genome having more insertions in one group vs another. A darker colour represents a more significant bias.
In the example below there is a cluster of insertions upstream of Myc in the sense orientation (Fwd Strand) prevalent in the late stage lymphomas but not the early infection cohort. These are more common in T cell lymphomas but are equally prevalent in both wild type and BCL2 transgenic cohorts.
Further downstream insertions upstream of and inside the Pvt1 non coding RNA are more frequently in the reverse orientation and slightly biased toward the wild type cohort but not the BCL2 transgenics.